 PDF(4767 KB)

基于多源遥感数据的区域生态系统服务价值年际动态监测——以中原城市群为例
王万同, 孙汀, 王金霞, 付强, 安传艳
地理科学 ›› 2019, Vol. 39 ›› Issue (4) : 680-687.
PDF(4767 KB)
PDF(4767 KB)
基于多源遥感数据的区域生态系统服务价值年际动态监测——以中原城市群为例
Annual Dynamic Monitoring of Regional Ecosystem Service ValueBased on Multi-source Remote Sensing Data: A Case of Central Plains Urban Agglomeration Region
 ({{custom_author.role_en}}), {{javascript:window.custom_author_en_index++;}}
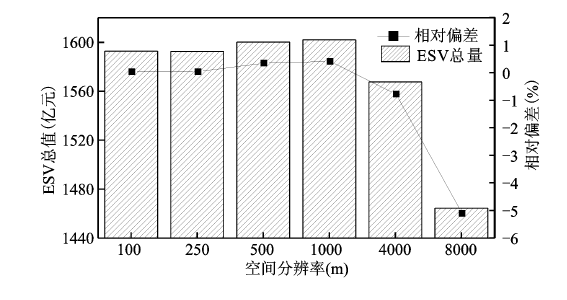
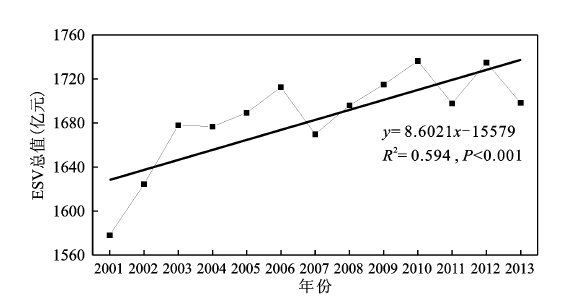
通过对多源遥感数据在生态系统服务价值(ESV)遥感模型中的尺度效应分析,选择满足最佳空间分辨率和长时间序列的遥感数据,对中原城市群区域2001~2013年的ESV实现了逐年逐像元水平的动态监测。结果表明:该区应用于遥感模型输入数据的最适空间分辨率为30~1 000 m,相对于30 m尺度,其他尺度估算结果的相对偏差均小于0.4%;结合年际动态监测的需求,选择了MODIS数据产品(空间分辨率500 m,时间尺度1 a)作为遥感模型的最佳数据源;研究区ESV总值在研究期内整体上呈显著增长趋势,增速约为8.6亿元/a,但在持续增长过程中经历了3次波动,且表现得越来越剧烈;在空间上,研究区ESV多年均值呈现出明显的不均衡性,表现为从西南向东部递减的趋势。研究表明此方法简单易行,初步实现了区域ESV年际动态监测遥感模型的准业务化运行。
Ecosystem service value (ESV) is not only one of the important parameters to study regional ecological economic harmony, but also a key indicator to improve the sustainable development. In recent years, based on remote sensing data, the ESV model has been gradually developed and widely used, whereas it is lacking in the application of regional ESV dynamic monitoring year by year. Here, the optimal spatial resolution and long time series of remote sensing data was selected by analyzing the scale effect, and regional ESV dynamic monitoring of year level was carried out on the pixel scale from 2001 to 2013 in Central Plains Urban Agglomeration region. The results showed that: 1) The range of the optimal spatial resolution was 30 m to 1 000 m for multi-source remote sensing data, and the relative deviation of the estimation results of different scales was less than 0.4%. With the demand of dynamic monitoring, the MODIS data products (spatial resolution was 500 m, and time scale was 1 year) were selected as the optimal data source for ESV model. 2) The total value of ESV in the study region showed a significant increasing trend from 2001 to 2013, with an increase of approximately 860 million yuan/a, but experienced three fluctuations in the continuous increasing process, and the performance was more and more intense. The dynamic change of ESV in the study region was uneven in the spatial distribution, and the growth area was slightly larger than the degraded area. Overall, the method of this article was simple and feasible, and the quasi-business operation of ESV remote sensing model was implemented.
生态系统服务价值 / 动态监测 / 多源遥感数据 / 尺度效应 / 中原城市群 {{custom_keyword}} /
ecosystem services value / dynamic monitoring / multi-source remote sensing data / scale effect / Central Plains Urban Agglomeration region {{custom_keyword}} /
表1 研究区2000年多尺度的土地覆被类型面积变化(km2)Table 1 Changes of land cover type area with different resolutions in study area in 2000 (km2) |
| 分辨率 | 30 m | 100 m | 250 m | 500 m | 1000 m | 4000 m | 8000 m |
|---|---|---|---|---|---|---|---|
| 林地 | 12347.77 | 12349.35 | 12344.56 | 12336.75 | 12397.00 | 12032.00 | 11968.00 |
| 草地 | 2110.98 | 2111.80 | 2105.13 | 2118.25 | 2108.00 | 2128.00 | 2368.00 |
| 水域 | 999.76 | 1000.56 | 1000.56 | 1001.75 | 1016.00 | 1104.00 | 512.00 |
| 耕地 | 36963.05 | 36961.58 | 36960.69 | 36961.75 | 37022.00 | 37280.00 | 39040.00 |
| 建设用地 | 6339.73 | 6337.57 | 6350.00 | 6340.75 | 6227.00 | 6336.00 | 5056.00 |
| 未利用地 | 16.28 | 16.20 | 17.56 | 19.75 | 16.00 | 16.00 | 0.00 |

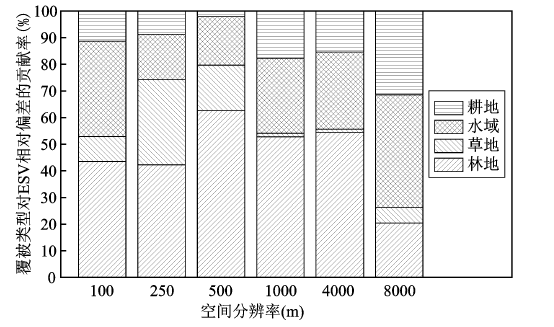
图3 各覆被类型对ESV总值相对偏差的贡献率Fig.3 Contribution rates of each land cover type to the relative deviation of ESV |
| [1] |
{{custom_citation.content}}
{{custom_citation.annotation}}
|
| [2] |
{{custom_citation.content}}
{{custom_citation.annotation}}
|
| [3] |
{{custom_citation.content}}
{{custom_citation.annotation}}
|
| [4] |
{{custom_citation.content}}
{{custom_citation.annotation}}
|
| [5] |
{{custom_citation.content}}
{{custom_citation.annotation}}
|
| [6] |
[
{{custom_citation.content}}
{{custom_citation.annotation}}
|
| [7] |
[
{{custom_citation.content}}
{{custom_citation.annotation}}
|
| [8] |
[
{{custom_citation.content}}
{{custom_citation.annotation}}
|
| [9] |
[
{{custom_citation.content}}
{{custom_citation.annotation}}
|
| [10] |
{{custom_citation.content}}
{{custom_citation.annotation}}
|
| [11] |
[
{{custom_citation.content}}
{{custom_citation.annotation}}
|
| [12] |
[
{{custom_citation.content}}
{{custom_citation.annotation}}
|
| [13] |
[
{{custom_citation.content}}
{{custom_citation.annotation}}
|
| [14] |
[
{{custom_citation.content}}
{{custom_citation.annotation}}
|
| [15] |
[
{{custom_citation.content}}
{{custom_citation.annotation}}
|
| [16] |
{{custom_citation.content}}
{{custom_citation.annotation}}
|
| [17] |
[
{{custom_citation.content}}
{{custom_citation.annotation}}
|
| [18] |
[
{{custom_citation.content}}
{{custom_citation.annotation}}
|
| [19] |
[
{{custom_citation.content}}
{{custom_citation.annotation}}
|
| [20] |
[
{{custom_citation.content}}
{{custom_citation.annotation}}
|
| [21] |
[
{{custom_citation.content}}
{{custom_citation.annotation}}
|
| [22] |
[
{{custom_citation.content}}
{{custom_citation.annotation}}
|
| [23] |
[
{{custom_citation.content}}
{{custom_citation.annotation}}
|
| [24] |
[
{{custom_citation.content}}
{{custom_citation.annotation}}
|
| [25] |
[
{{custom_citation.content}}
{{custom_citation.annotation}}
|
| [26] |
[
{{custom_citation.content}}
{{custom_citation.annotation}}
|
| {{custom_ref.label}} |
{{custom_citation.content}}
{{custom_citation.annotation}}
|
The authors have declared that no competing interests exist.


 PDF(4767 KB)
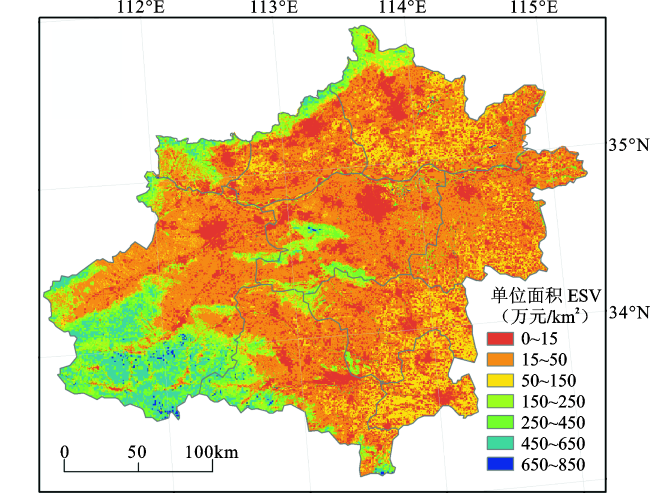
 图1 中原城市群位置
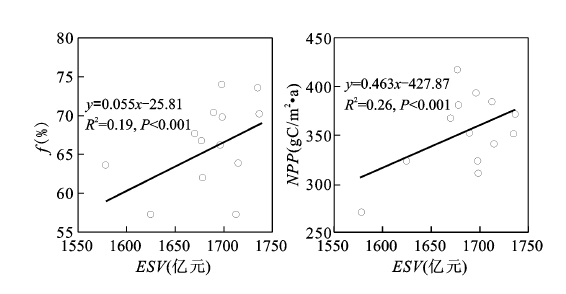
 表1 研究区2000年多尺度的土地覆被类型面积变化(km2)图2 情景1下多尺度的研究区ESV总值及相对偏差图3 各覆被类型对ESV总值相对偏差的贡献率图4 情景2下多尺度的研究区ESV总值变化及相对偏差图5 研究区2001~2013年单位面积ESV年均值空间分布格局图6 研究区2001~2013年ESV总值年际变化特征图7 ESV与f及NPP的相关分析
/
| 〈 |
|
〉 |


