 PDF(40356 KB)
 PDF(40356 KB)
PDF(40356 KB)
PDF(40356 KB)
多源遥感影像深度特征融合匹配算法
Multi-source Remote Sensing Image Deep Feature Fusion Matching Algorithm
 ({{custom_author.role_en}}), {{javascript:window.custom_author_en_index++;}}
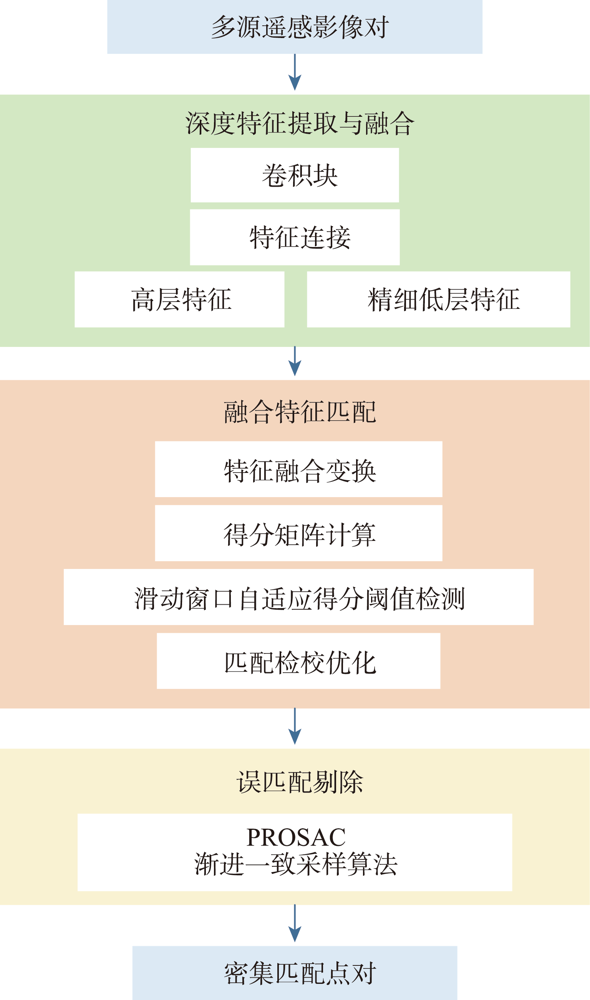
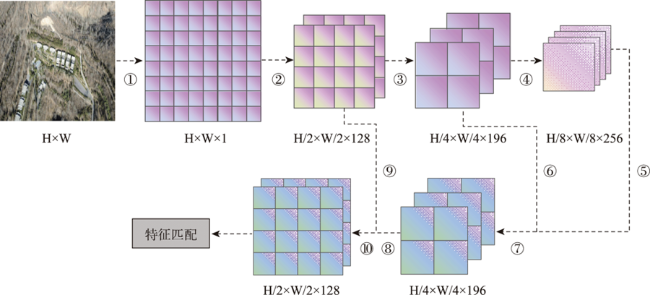
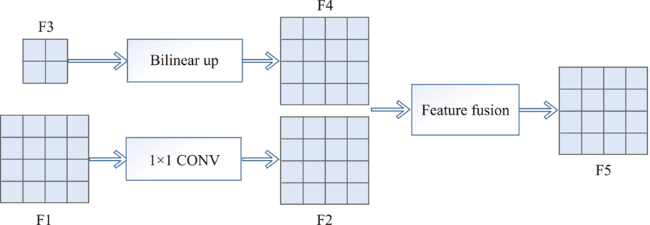
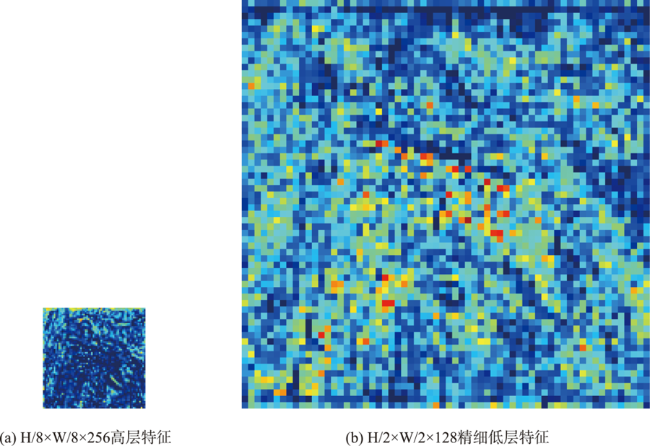
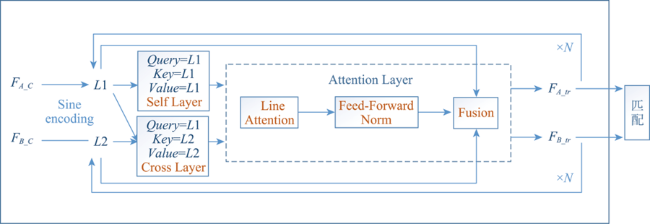
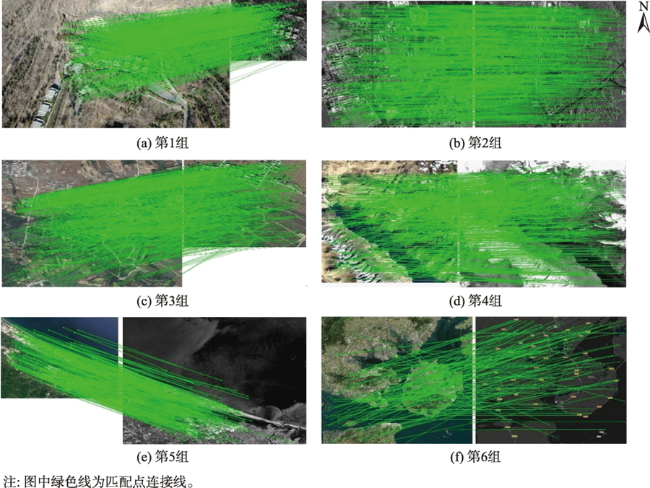
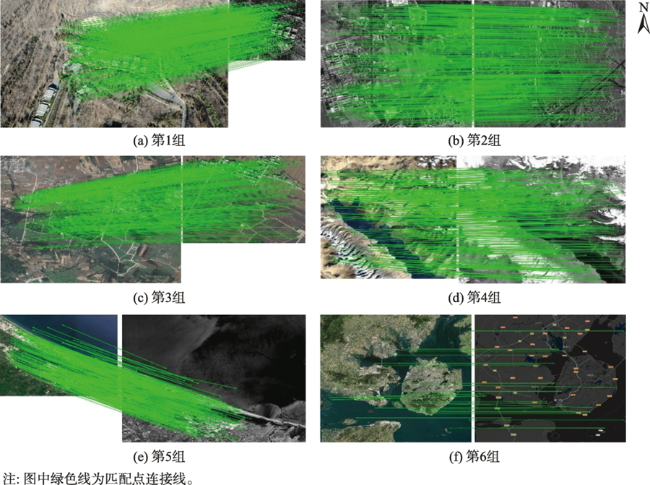
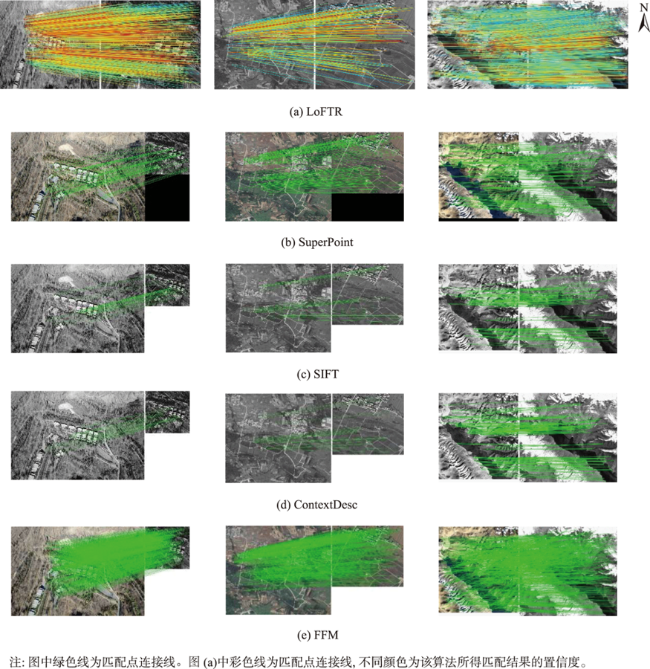
针对多源遥感影像之间成像机理不同、非线性光谱辐射畸变大以及灰度梯度差异明显等所导致的匹配困难问题,提出深度特征融合匹配算法(Feature Fusion Matching Algorithm, FFM)。① 通过构建特征图金字塔网络提取影像深度特征,使用特征连接结构将语义丰富的高层特征与定位精确的低层特征互补融合,解决多源影像同名特征难以表征的问题并提高特征向量的定位精度;② 对原始维度1/8的特征图进行交叉变换来融合自身邻域信息与待匹配影像特征信息,通过计算特征向量间的相似性得分得到初次匹配结果,针对特征稀疏区域,提出滑动窗口自适应得分阈值检测算法来提升匹配效果;③ 将匹配结果映射至亚像素级特征图,在小窗口内计算像素间的匹配概率分布期望值来检校优化匹配结果,提高匹配点对的准确性;④ 使用PROSAC算法对匹配结果进行提纯,有效剔除误匹配的同时最大限度保留正确匹配点。试验选取6对多源遥感影像,将FFM同SuperPoint、SIFT、ContextDesc以及LoFTR算法进行对比,结果表明FFM算法在匹配点正确率、匹配点均方根误差以及分布均匀度等方面远优于其他算法。将FFM匹配结果用于多源遥感影像配准,配准效果得到较高提升。
Focusing on the difficulty in image matching caused by different imaging mechanisms and large nonlinear spectral radiation distortion between multi-source remote sensing images, a deep Feature Fusion Matching (FFM) algorithm is proposed in this study. Firstly, the feature pyramid network is constructed to extract image deep features, and the feature connection structure is used to complementarily fuse high-level features with rich semantics and low-level features with accurate positioning, so as to solve the problem of difficult representation of homonymous features in multi-source remote sensing images and improve the positioning accuracy of feature vectors. Secondly, the feature map of the original dimension 1/8 is cross transformed to fuse its own neighborhood information and the feature information of the image to be matched. The first matching result is obtained by calculating the similarity score between the feature vectors. For the sparse feature area, an adaptive score threshold detection algorithm using sliding window is proposed to improve the matching effectiveness for sparse feature regions. Then the matching results are mapped to the sub-pixel feature graph, and the expected value of the matching probability distribution between pixels is calculated in a small window to check and optimize the matching results and improve the accuracy of matching point pairs. Finally, the PROSAC algorithm is used to purify the precise matching results, which can effectively eliminate the false matching and keep the correct matching points to the maximum extent. The experiment selects six pairs of multi-source remote sensing images, and compares FFM with SuperPoint, SIFT, ContextDesc, and LoFTR algorithms. The results show that the FFM algorithm is superior to other algorithms in terms of number of correct matching point pairs, matching point accuracy, matching point root mean square error, and matching point distribution uniformity. The FFM matching results are used for multi-source remote sensing images registration, and the registration efficiency is also greatly improved.
多源遥感影像 / 深度特征融合 / 自适应得分阈值 / 影像匹配 / PROSAC / 匹配分布均匀度 / 影像配准 {{custom_keyword}} /
multi-source remote sensing image / deep feature fusion / adaptive score threshold / image matching / PROSAC / matching distribution uniformity / image registration {{custom_keyword}} /
| 算法1 滑动窗口自适应得分阈值检测 |
|---|
| 1. 初始化滑动窗口 2. 窗口滑动检测 若当前窗口内所有特征得分 计算匹配稀疏节点内自适应阈值 遍历窗口内特征向量,若得分 窗口滑动 若当前窗口存在特征向量得分 ×窗口滑动 3. 窗口滑动遍历 |
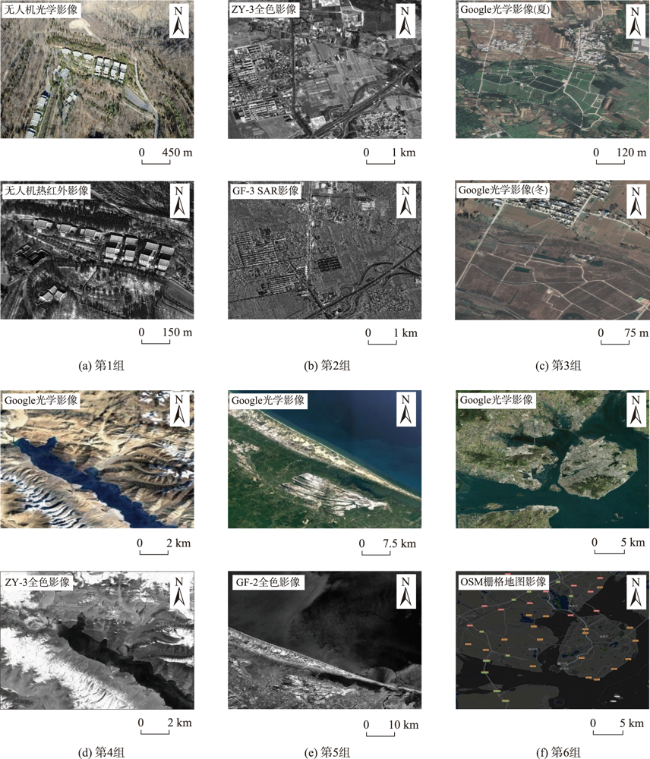
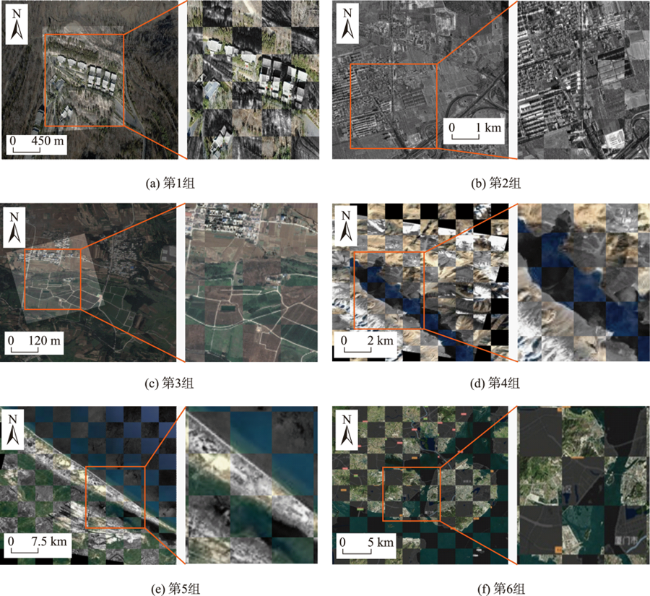
表1 试验数据对比分析Tab. 1 Comparative analysis of test data |
| 影像组别 | ||||||
|---|---|---|---|---|---|---|
| 第1组 | 第2组 | 第3组 | 第4组 | 第5组 | 第6组 | |
| 基准影像 类型 | 无人机 光学影像 | ZY-3 PAN 全色影像 | Google 光学影像(夏) | Google 光学影像 | Google 光学影像 | Google 光学影像 |
| 图幅/像素 | 1920×1080 | 1000×1000 | 960×960 | 512×512 | 256×256 | 500×500 |
| 分辨率/m | - | 2.5 | 0.5 | 160 | 120 | 40 |
| 待匹配 影像类型 | 无人机 热红外影像 | GF-3 SAR | Google 光学影像(冬) | ZY-3 PAN 全色影像 | GF-2 PAN 全色影像 | OSM 栅格地图 |
| 图幅/像素 | 640×512 | 1000×1000 | 640×640 | 628×531 | 400×400 | 500×500 |
| 分辨率/m | - | 2.5 | 0.5 | 160 | 120 | 40 |
| 差异 | 可见光-热红外,成像模式与波段不同,角度、尺度差异大 | 光学-SAR,成像模式不同,灰度梯度差异大[1] | 时相差异大,冬夏季地物差异明显,角度尺度差异明显 | 普通光学影像-全色影像,波段不同,灰度差异明显 | 普通光学影像-全色影像,波段不同,灰度差异明显 | 可见光-栅格地图,不同地图模式,灰度差异大[1] |
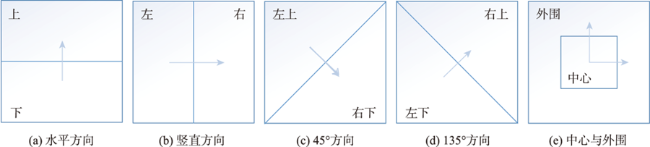
| 算法2 匹配点对分布均匀度计算 |
|---|
| 1. 根据图10将影像划分为5个方向即10个区域 2. 分别统计每个区域内的匹配点数量 3. 将10个区域内的匹配点数量组合为区域统计分布向量 4. 利用式(11)计算匹配点分布均匀度 |
表2 匹配试验结果对比Tab. 2 Comparison of registration test results |
| 影像组别 | |||||||
|---|---|---|---|---|---|---|---|
| 第1组 | 第2组 | 第3组 | 第4组 | 第5组 | 第6组 | ||
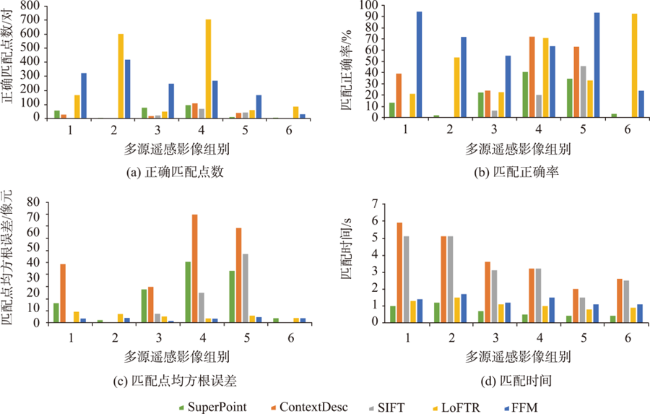
| P/对 | SuperPoint | 56 | 4 | 76 | 94 | 10 | 2 |
| ContextDesc | 27 | 0 | 17 | 107 | 39 | 0 | |
| SIFT | 0 | 0 | 21 | 68 | 42 | 0 | |
| LoFTR | 165 | 598 | 49 | 701 | 59 | 84 | |
| FFM | 321 | 416 | 246 | 267 | 165 | 30 | |
| MA/% | SuperPoint | 13.1 | 1.9 | 22.2 | 40.5 | 34.48 | 3.17 |
| ContextDesc | 39 | 0 | 23.9 | 71.8 | 62.9 | 0 | |
| SIFT | 0 | 0 | 6.1 | 20.0 | 45.65 | 0 | |
| LoFTR | 21.02 | 53.35 | 22.48 | 70.67 | 32.96 | 92.3 | |
| FFM | 94.1 | 71.6 | 54.91 | 63.4 | 93.2 | 23.8 | |
| RMSE | SuperPoint | 5.3140 | 38.8776 | 3.3387 | 4.3474 | 10.4386 | - |
| ContextDesc | 16.2799 | - | 8.3289 | 4.6065 | 10.729 | - | |
| SIFT | - | - | 7.8878 | 4.551 | 8.53 | - | |
| LoFTR | 7.4840 | 5.9680 | 4.3220 | 3.0455 | 4.85276 | 3.2743 | |
| FFM | 2.9675 | 3.3287 | 1.3759 | 2.87 | 3.89 | 3.1744 | |
| t | SuperPoint | 1.0 | 1.2 | 0.7 | 0.5 | 0.43 | 0.43 |
| ContextDesc | 5.9 | 5.1 | 3.6 | 3.2 | 2 | 2.6 | |
| SIFT | 5.1 | 5.1 | 3.1 | 3.2 | 1.5 | 2.5 | |
| LoFTR | 1.3 | 1.5 | 1.1 | 1.0 | 0.8 | 0.9 | |
| FFM | 1.4 | 1.7 | 1.2 | 1.5 | 1.1 | 1.1 | |
| 注:表中加粗数值表示本文FFM算法所得结果。 |
表3 匹配点分布均匀度对比Tab. 3 Matching point distribution uniformity comparison |
| 影像组别 | 1 | 2 | 3 | 4 | 5 | 6 |
|---|---|---|---|---|---|---|
| LoFTR | -10.4480 | -10.3252 | -9.4438 | -10.2546 | -9.7833 | -7.9718 |
| FFM | -9.7832 | -9.1421 | -8.3388 | -7.5459 | -8.2412 | -3.485 |
| [1] |
蓝朝桢, 卢万杰, 于君明, 等. 异源遥感影像特征匹配的深度学习算法[J]. 测绘学报, 2021, 50(2):189-202.
[
{{custom_citation.content}}
{{custom_citation.annotation}}
|
| [2] |
李力, 纪松, 于英, 等. 一种基于组合特征的多源遥感影像配准方法[J]. 测绘科学技术学报, 2020, 37(1):74-78.
[
{{custom_citation.content}}
{{custom_citation.annotation}}
|
| [3] |
{{custom_citation.content}}
{{custom_citation.annotation}}
|
| [4] |
{{custom_citation.content}}
{{custom_citation.annotation}}
|
| [5] |
{{custom_citation.content}}
{{custom_citation.annotation}}
|
| [6] |
姚永祥, 张永军, 万一, 等. 顾及各向异性加权力矩与绝对相位方向的异源影像匹配[J]. 武汉大学学报·信息科学版, 2021, 46(11):1727-1736.
[
{{custom_citation.content}}
{{custom_citation.annotation}}
|
| [7] |
{{custom_citation.content}}
{{custom_citation.annotation}}
|
| [8] |
{{custom_citation.content}}
{{custom_citation.annotation}}
|
| [9] |
{{custom_citation.content}}
{{custom_citation.annotation}}
|
| [10] |
{{custom_citation.content}}
{{custom_citation.annotation}}
|
| [11] |
{{custom_citation.content}}
{{custom_citation.annotation}}
|
| [12] |
{{custom_citation.content}}
{{custom_citation.annotation}}
|
| [13] |
{{custom_citation.content}}
{{custom_citation.annotation}}
|
| [14] |
{{custom_citation.content}}
{{custom_citation.annotation}}
|
| [15] |
{{custom_citation.content}}
{{custom_citation.annotation}}
|
| [16] |
{{custom_citation.content}}
{{custom_citation.annotation}}
|
| [17] |
{{custom_citation.content}}
{{custom_citation.annotation}}
|
| [18] |
{{custom_citation.content}}
{{custom_citation.annotation}}
|
| [19] |
{{custom_citation.content}}
{{custom_citation.annotation}}
|
| [20] |
崔志祥, 蓝朝桢, 熊新, 等. 一种无人机热红外与可见光影像匹配方法[J]. 测绘科学技术学报, 2019, 36(6):609-613.
[
{{custom_citation.content}}
{{custom_citation.annotation}}
|
| [21] |
满孝成, 姚国标, 张传辉, 等. 融合多类特征的海岸带特殊纹理影像全自动配准[J]. 测绘科学, 2020, 45(8):130-137.
[
{{custom_citation.content}}
{{custom_citation.annotation}}
|
| [22] |
朱海峰, 赵春晖. 图像特征点分布均匀性的评价方法[J]. 大庆师范学院学报, 2010, 30(3):9-12.
[
{{custom_citation.content}}
{{custom_citation.annotation}}
|
| [23] |
{{custom_citation.content}}
{{custom_citation.annotation}}
|
| {{custom_ref.label}} |
{{custom_citation.content}}
{{custom_citation.annotation}}
|


 PDF(40356 KB)
 图1 FFM算法技术路线图2 特征提取网络结构图3 卷积块结构图4 特征连接结构图5 特征图可视化图6 特征变换融合流程
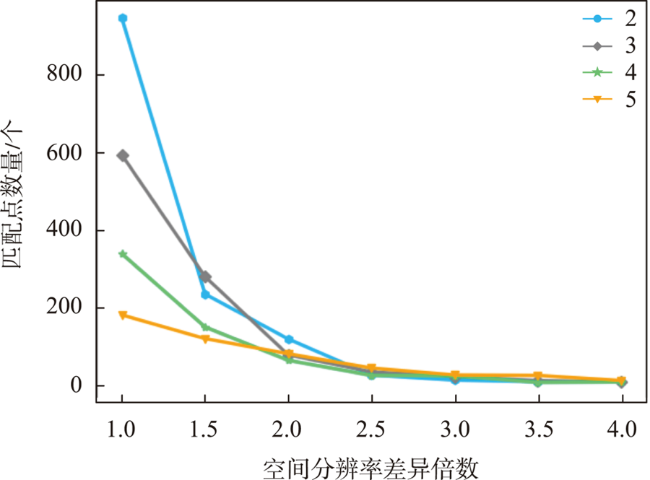
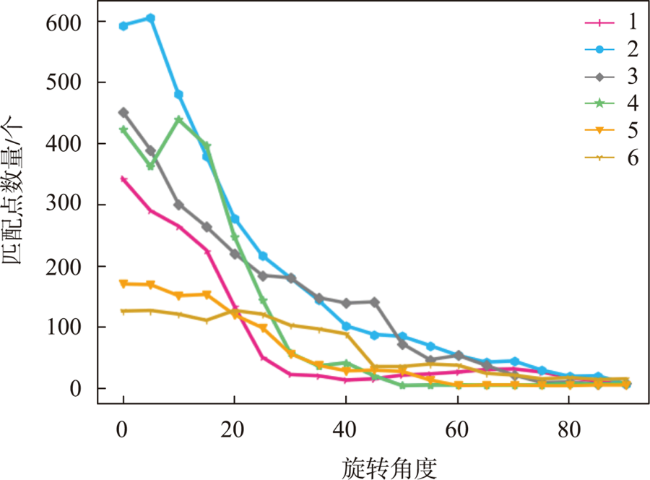
 图7 试验原始多源遥感影像对表1 试验数据对比分析图8 空间分辨率适应性评估图9 旋转适应性评估图10 5个方向划分示意图[22]表2 匹配试验结果对比图11 匹配性能对比柱状图表3 匹配点分布均匀度对比图12 FFM初始匹配结果图13 FFM匹配提纯结果图14 不同算法匹配效果对比图15 配准结果及局部开窗图
/
| 〈 |
|
〉 |


 AI Summary

