 PDF(4103 KB)
 PDF(4103 KB)
PDF(4103 KB)
PDF(4103 KB)
长江中游城市群“文—旅”产业融合发展的空间效应及驱动机制研究
 ({{custom_author.role_cn}}), {{javascript:window.custom_author_cn_index++;}}
Spatial effect and driving mechanism of the integrated development of culture-tourism industries in the middle Yangtze River Basin urban agglomeration
({{custom_author.role_en}}), {{javascript:window.custom_author_en_index++;}}“文—旅”产业融合发展为产业结构高质量转型、空间统筹优化和区域经济韧性提升赋能。在由“宏观—中观—微观”三维尺度复合而成的城市群“文—旅”产业融合发展理论基础上,论文构建了城市群“文—旅”产业融合发展评价指标体系,以长江中游城市群为研究对象,借助耦合协调模型和极化指数模型对2010—2019年区域“文—旅”产业融合发展水平进行测算并分析其空间效应,并探究该区域“文—旅”产业融合发展的驱动机制。结果显示:① 长江中游城市群“文—旅”产业融合发展的各子系统间具有较强的互动关系,但多数城市暂未达到良性发展状态;② 研究期内,长江中游城市群“文—旅”产业融合发展的空间效应表现出“极化效应”显著、“回程效应”与“扩散效应”微弱的特征;③ 长江中游城市群“文—旅”产业融合发展在空间上呈现以“武汉—长沙—南昌”为核心的“核心—边缘”结构;④ 长江中游城市群“文—旅”产业融合发展是在资源禀赋基础力、居民消费需求力、基础设施保障力、规模效益催动力、人力资源潜在力、经济发展拉动力“六力”共同驱动下形成的。最后,根据长江中游城市群“文—旅”产业融合发展现状,提出强化区域联动、瞄准核心驱动力等针对性建议,推动长江中游城市群区域一体化建设和地方经济高质量发展。
The integrated development of culture-tourism industries enables the high-quality transformation of regional industrial structure, overall spatial optimization, and improvement of regional economic resilience. Based on the theory of integrated development of culture-tourism industries in urban agglomerations incorporating the macro, meso, and micro scales, this study constructed the evaluation indicator system of integrated development of culture-tourism industries of urban agglomerations, and the middle Yangtze River Basin urban agglomeration was taken as the research object. The coupling coordination model and polarization index model were used to calculate the integrated development level of culture-tourism industries in the urban agglomeration from 2010 to 2019, and the spatial effect was analyzed. The driving mechanism of integrated development of culture-tourism industries was also explored. Four highlighted results are unveiled: 1) There is a strong interactive relationship between the subsystems of the integrated development of culture-tourism industries in the urban agglomeration. Most cities have not reached a benign development state. 2) During the study period, the spatial effect of the integrated development of culture-tourism industries in the region was characterized by polarization, while the "return effect" and "diffusion effect" were weak. 3) A core-periphery structure with Wuhan-Changsha-Nanchang as the cores was present. 4) The integrated development of culture-tourism industries in the region was jointly driven by six factors: Resource endowment, consumption demand, infrastructure support, scale efficiency, economic development, and human resource potential. According to the status of the integrated development of culture-tourism industries in the urban agglomeration, this article put forward specific recommendations of strengthening regional linkage and targeting the core driving factors to promote the regional integration construction and high-quality development of local economy in the middle Yangtze River Basin urban agglomeration.
"文-旅"产业融合 / 耦合协调 / 空间效应 / 驱动机制 / 长江中游城市群 {{custom_keyword}} /
integrated development of culture-tourism industries / coupling coordination / spatial effect / driving mechanism / middle Yangtze River Basin urban agglomeration {{custom_keyword}} /
表1 城市群“文—旅”产业融合发展评价指标体系Tab.1 Evaluation indicator system for the integrated development of culture-tourism industries in urban agglomerations |
| 目标层 | 系统层 | 指标层 | 指标含义与性质 | 权重 |
|---|---|---|---|---|
| 城市群“文—旅” 产业融合发展 | 产业融合资源本底 | X1 非物质文化遗产指数 | 表征区域非物质型文旅资源(+) | 0.020 |
| X2 文物保护单位指数 | 表征区域物质型文旅资源(+) | 0.027 | ||
| X3 国家级传统村落数量(个) | 表征区域物质型文旅资源(+) | 0.075 | ||
| X4 星级旅游景区指数 | 表征区域物质型文旅资源(+) | 0.037 | ||
| X5 博物馆数量(个) | 表征区域文旅资源载体(+) | 0.034 | ||
| X6 图书馆数量(个) | 表征区域文旅资源载体(+) | 0.031 | ||
| X7 剧场、影剧院数量(个) | 表征区域文旅资源载体(+) | 0.042 | ||
| 产业融合支撑 | X8 年末实有城市道路面积(万m2) | 表征区域交通通达度(+) | 0.041 | |
| X9 普通高等学校在校学生数(人) | 表征区域人才储备水平(+) | 0.077 | ||
| X10 有效专利数(个) | 表征区域科技创新能力(+) | 0.065 | ||
| X11 移动电话普及率(%) | 表征区域信息化水平(+) | 0.013 | ||
| X12 人均消费支出(元) | 表征区域居民消费潜在能力(+) | 0.006 | ||
| X13 固定资产投资额(万元) | 表征区域社会投资能力(+) | 0.028 | ||
| X14 人均GDP(元) | 表征区域经济发展水平(+) | 0.019 | ||
| X15 第三产业增加值占GDP的比重(%) | 表征区域产业结构高级化状况(+) | 0.011 | ||
| X16 建成区绿化覆盖率(%) | 表征区域城市环境状态(+) | 0.009 | ||
| 产业融合规模 | X17 星级饭店数量(个) | 表征产业融合机构规模(+) | 0.017 | |
| X18 旅行社数量(个) | 表征产业融合机构规模(+) | 0.037 | ||
| X19 图书馆总流通人次(千人次) | 表征产业融合接待规模(+) | 0.030 | ||
| X20 博物馆接待参观人数(千人次) | 表征产业融合接待规模(+) | 0.029 | ||
| X21 剧场、影剧院总流通人数(千人次) | 表征产业融合接待规模(+) | 0.034 | ||
| X22 国内游客人数(万人次) | 表征产业融合接待规模(+) | 0.034 | ||
| X23 入境游客人数(人次) | 表征产业融合接待规模(+) | 0.080 | ||
| X24 文化产业增加值(万元) | 表征产业融合效益规模(+) | 0.048 | ||
| X25 国内旅游收入(亿元) | 表征产业融合效益规模(+) | 0.047 | ||
| X26 国际旅游外汇收入(万美元) | 表征产业融合效益规模(+) | 0.109 |
| 注:非物质文化遗产指数、文物保护单位指数按照级别进行赋值累加(国家级、省级分别对应5、2.5分);星级旅游景区指数按照各星级旅游景区级别赋值累加(5A、4A、3A、2A、1A分别对应5、3、2、1、0.5分);移动电话普及率=年末移动电话用户数/年末总人口数。 |
表2 “文—旅”产业融合发展耦合度与耦合协调度划分标准Tab.2 Standard for classifying the coupling degree and coupling coordination degree of the integrated development of culture-tourism industries |
| 耦合度 | 耦合协调度 | |||
|---|---|---|---|---|
| 数值 | 类型 | 数值 | 类型 | |
| (0, 0.30] | 恶性耦合 | (0, 0.20] | 低度耦合协调 | |
| (0.30, 0.50] | 拮抗阶段 | (0.20, 0.30] | 较低度耦合协调 | |
| (0.50, 0.80] | 磨合阶段 | (0.30, 0.50] | 中度耦合协调 | |
| (0.80, 1.00] | 良性耦合 | (0.50, 0.80] | 高度耦合协调 | |
| (0.80, 1.00] | 极度耦合协调 | |||
表3 2010—2019年长江中游城市群“文—旅”产业融合发展耦合度和耦合协调度统计特征及其分布区间占比Tab.3 Statistical characteristics and distribution interval of the coupling degree and coupling coordination degree of the integrated development of culture-tourism industries in the middle Yangtze River Basin urban agglomeration during 2010-2019 |
| 指标 | 数值 | 2010年 | 2011年 | 2012年 | 2013年 | 2014年 | 2015年 | 2016年 | 2017年 | 2018年 | 2019年 |
|---|---|---|---|---|---|---|---|---|---|---|---|
| 耦合度等级区间 | (0.50, 0.80] | 0.10 | 0.10 | 0.06 | 0 | 0 | 0 | 0 | 0 | 0 | 0 |
| (0.80, 1.00] | 0.90 | 0.90 | 0.94 | 1.00 | 1.00 | 1.00 | 1.00 | 1.00 | 1.00 | 1.00 | |
| 耦合协调度 等级区间 | (0, 0.20] | 0.90 | 0.87 | 0.87 | 0.87 | 0.77 | 0.68 | 0.58 | 0.48 | 0.42 | 0.35 |
| (0.20, 0.30] | 0.06 | 0.10 | 0.10 | 0.06 | 0.16 | 0.26 | 0.35 | 0.42 | 0.48 | 0.55 | |
| (0.30, 0.50] | 0.03 | 0.03 | 0.03 | 0.06 | 0.06 | 0.06 | 0.06 | 0.10 | 0.06 | 0.06 | |
| (0.50, 0.80] | 0 | 0 | 0 | 0 | 0 | 0 | 0 | 0 | 0.03 | 0.03 | |
| 耦合度统计特征 | 平均值 | 0.93 | 0.93 | 0.94 | 0.95 | 0.95 | 0.95 | 0.95 | 0.95 | 0.95 | 0.95 |
| 最小值 | 0.74 | 0.75 | 0.77 | 0.82 | 0.83 | 0.84 | 0.84 | 0.85 | 0.86 | 0.86 | |
| 耦合协调度 统计特征 | 平均值 | 0.14 | 0.14 | 0.15 | 0.17 | 0.18 | 0.19 | 0.20 | 0.21 | 0.22 | 0.23 |
| 方差 | 0 | 0 | 0 | 0 | 0.01 | 0.01 | 0.01 | 0.01 | 0.01 | 0.01 | |
| 最小值 | 0.04 | 0.05 | 0.05 | 0.06 | 0.07 | 0.07 | 0.08 | 0.08 | 0.09 | 0.09 | |
| 极差 | 0.30 | 0.31 | 0.33 | 0.36 | 0.37 | 0.39 | 0.39 | 0.40 | 0.41 | 0.43 |

图2 2010—2019年长江中游城市群“文—旅”产业融合发展极化趋势Fig.2 Trend of integrated development polarization of culture-tourism industries in the middle Yangtze River Basin urban agglomeration during 2010-2019 |
| [1] |
厉无畏, 王慧敏. 产业发展的趋势研判与理性思考[J]. 中国工业经济, 2002(4): 5-11.
[
{{custom_citation.content}}
{{custom_citation.annotation}}
|
| [2] |
朱鹤, 张圆刚, 林明水, 等. 国土空间优化背景下文旅产业高质量发展: 特征、认识与关键问题[J]. 经济地理, 2021, 41(3): 1-15.
[
{{custom_citation.content}}
{{custom_citation.annotation}}
|
| [3] |
庄志民. 复合生态系统理论视角下的文化与旅游融合实践探索: 以上海为例[J]. 旅游科学, 2020, 34(4): 31-45.
[
{{custom_citation.content}}
{{custom_citation.annotation}}
|
| [4] |
马波, 张越. 文旅融合四象限模型及其应用[J]. 旅游学刊, 2020, 35(5): 15-21.
[
{{custom_citation.content}}
{{custom_citation.annotation}}
|
| [5] |
黄锐, 谢朝武, 李勇泉. 中国文化旅游产业政策演进及有效性分析: 基于2009-2018年政策样本的实证研究[J]. 旅游学刊, 2021, 36(1): 27-40.
[
{{custom_citation.content}}
{{custom_citation.annotation}}
|
| [6] |
中华人民共和国中央人民政府. 文化和旅游部发布《"十四五"文化和旅游发展规划》[EB/OL]. 2021-06-04 [2021-08-13]. http://www.gov.cn/xinwen/2021-06/04/content_5615466.htm.
[ Central People's Government of the People's Republic of China. The ministry of culture and tourism of the People's Republic of China released the "14th Five-Year Plan" for cultural and tourism development. 2021-06-04 [2021-08-13]. http://www.gov.cn/xinwen/2021-06/04/content_5615466.htm.
{{custom_citation.content}}
{{custom_citation.annotation}}
|
| [7] |
{{custom_citation.content}}
{{custom_citation.annotation}}
|
| [8] |
{{custom_citation.content}}
{{custom_citation.annotation}}
|
| [9] |
{{custom_citation.content}}
{{custom_citation.annotation}}
|
| [10] |
{{custom_citation.content}}
{{custom_citation.annotation}}
|
| [11] |
{{custom_citation.content}}
{{custom_citation.annotation}}
|
| [12] |
{{custom_citation.content}}
{{custom_citation.annotation}}
|
| [13] |
{{custom_citation.content}}
{{custom_citation.annotation}}
|
| [14] |
{{custom_citation.content}}
{{custom_citation.annotation}}
|
| [15] |
胡婷, 许春晓, 王甫园. 文化旅游资源市场价值及其空间分布特征: 以湖南湘西州为例[J]. 经济地理, 2020, 40(7): 220-230.
[
{{custom_citation.content}}
{{custom_citation.annotation}}
|
| [16] |
张朝枝, 朱敏敏. 文化和旅游融合: 多层次关系内涵、挑战与践行路径[J]. 旅游学刊, 2020, 35(3): 62-71.
[
{{custom_citation.content}}
{{custom_citation.annotation}}
|
| [17] |
崔凤军, 张英杰. 机构改革促进文旅融合效果评估及提升路径: 以浙江省为例[J]. 地域研究与开发, 2021, 40(5): 101-106.
[
{{custom_citation.content}}
{{custom_citation.annotation}}
|
| [18] |
孙剑锋, 李世泰, 纪晓萌, 等. 山东省文化资源与旅游产业协调发展评价与优化[J]. 经济地理, 2019, 39(8): 207-215.
[
{{custom_citation.content}}
{{custom_citation.annotation}}
|
| [19] |
刘安乐, 杨承玥, 明庆忠, 等. 中国文化产业与旅游产业协调态势及其驱动力[J]. 经济地理, 2020, 40(6): 203-213.
[
{{custom_citation.content}}
{{custom_citation.annotation}}
|
| [20] |
于秋阳, 王倩, 颜鑫. 长三角城市群文旅融合: 耦合协调、时空演进与发展路径研究[J]. 华东师范大学学报(哲学社会科学版), 2022, 54(2): 159-172, 178.
[
{{custom_citation.content}}
{{custom_citation.annotation}}
|
| [21] |
赵嫚, 王如忠. 中国文化产业和旅游产业融合发展动力机制与发展评价[J]. 生态经济, 2022 38(2): 121-129.
[
{{custom_citation.content}}
{{custom_citation.annotation}}
|
| [22] |
李丽, 徐佳. 中国文旅产业融合发展水平测度及其驱动因素分析[J]. 统计与决策, 2020, 36(20): 49-52.
[
{{custom_citation.content}}
{{custom_citation.annotation}}
|
| [23] |
朱媛媛, 周笑琦, 罗静, 等. 长江中游城市群乡村人居环境质量评价及其时空分异[J]. 经济地理, 2021, 41(4): 127-136.
[
{{custom_citation.content}}
{{custom_citation.annotation}}
|
| [24] |
麻学锋, 何颖怡, 孙根年. 旅游投资决定机制及其时空响应: 以张家界为例[J]. 地理科学进展, 2014, 33(2): 222-231.
以张家界为例,分析了旅游投资决定机制的演变;运用旅游产业响应强度模型,分析武陵源区对旅游投资的时间响应特征,并阐述了在政府和市场作用下张家界旅游产业的空间响应和重构。结果显示:① 从投资决定机制演变看,投资制度安排决定了张家界旅游发展不同时期的投资主体差异,并随制度的演变,凸显了阶段性旅游投资分工格局。② 从时间响应看,在出现期,响应系数由1989年的0.1282增加到1992年的0.1341;在生成期,由1993年的0.1631提高到1999年的0.8511;在发展期,再从2000年的0.8767提高到2012年的1.1214,反映出旅游投资力度的强弱直接影响响应系数的大小。③ 从空间响应看,在政府、世界遗产管理制度和市场共同作用下,形成了以武陵源和天门山两个5A级景区为核心的空间格局,以及“景区游,城区住”的产业布局;经过重构后,旅游服务密度的排序为:桑植县<慈利县<永定区<武陵源区。
[
Tourism investment has become a new topic in the academic community of tourism research in recent years. In this paper we analyzed tourism investment decision-making mechanism and corresponding consequences, and, taking Zhangjiajie as an example, explored the evolution of tourism investment decision-making mechanism and set up a model for the response strength of the tourism industry. The model helped study the characteristics of temporal responses of Wulingyuan scenic spot and analyze specifically the temporal responses and the reconstruction of the evolutional process of Zhangjiajie tourism industry under the effects of local government and the market. The results showed that: (1) From the viewpoint of tourism investment decision-making mechanism, tourism investors have been changing dynamically and directly affected the growth of the industry in the different stages, and the changes of tourism investors in the different growth stages of Zhangjiajie tourism industry were determined by tourism investment policies and regulations. In addition, tourism investors played different roles in the different stages of the tourism industry growth along with the evolution of the tourism investment system itself. Government and state-owned enterprises at all levels were the main sources of the investments in the emergence stage of the tourism industry growth in Zhangjiajie, with the government investments together with private investments as the main source in the initial stage, and private investments as the major source and government investment as the complementary source in the developmental stage. (2) From the viewpoint of the temporal responses in Zhangjiajie, the calculated response coefficient was overall in a rising trend with periodic fluctuations, showing the increasingly positive effects of the tourism investments on the growth of the tourism industry. Response coefficient of the tourism industry growth had a slow and steady increase of 0.006 from 0.1282 in 1989 to 0.1341 in 1992 because of a relatively small tourism investment in the emergence stage. The response coefficient enjoyed a sharp increase of 421.83% from 0.1631 in 1993 to 0.8511 in 1999 as a result of diversified tourism investments and optimized investment and financing environment in the growth stage, an increase from 0.8767 in 2000 to 1.1214 in 2012 with enhanced popularity and further optimized tourism investment environment and system. (3) From the viewpoint of the spatial responses, the "core-edge" pattern of Zhangjiajie tourism industry growth and reconstruction were formed under the combined efforts of local government, the world heritage management system and the market. The tourism spatial pattern includes two of the National 5A Scenery Sites, Wulingyuan scenic spot and Tianmen Mountain, as the center. After industry reconstruction the ranking order of the tourism services density is: Sangzhi County<Cili County<Yongding District< Wulingyuan District. In summary, taking the tourist city, Zhangjiajie, as an example, in this paper, we explored the influencing factors and internal mechanisms of the tourism investment, analyzed investment results together with the tourism industry growth to reveal the roles of the strengths of the spatio-temporal responses in the tourism industry growth. The research results can help enrich the theories for the analysis of tourism investment and industry regional responses and guide the tourism investment practices and industrial development of Zhangjiajie and other similar areas.
{{custom_citation.content}}
{{custom_citation.annotation}}
|
| [25] |
厉新建, 宋昌耀, 殷婷婷. 高质量文旅融合发展的学术再思考: 难点和路径[J]. 旅游学刊, 2022, 37(2): 5-6.
[
{{custom_citation.content}}
{{custom_citation.annotation}}
|
| [26] |
王利伟, 赵明. 中国城镇化演进的系统逻辑: 基于人地关系视角[J]. 城市规划, 2014, 38(4): 17-22, 33.
[
{{custom_citation.content}}
{{custom_citation.annotation}}
|
| [27] |
李凯, 刘涛, 曹广忠. 城市群空间集聚和扩散的特征与机制: 以长三角城市群、武汉城市群和成渝城市群为例[J]. 城市规划, 2016, 40(2): 18-26, 60.
[
{{custom_citation.content}}
{{custom_citation.annotation}}
|
| [28] |
周磊, 孙宁华, 缪烨峰, 等. 极化与扩散: 长三角在区域均衡发展中的作用: 来自长三角与长江中游城市群的证据[J]. 长江流域资源与环境, 2021, 30(4): 782-795.
[
{{custom_citation.content}}
{{custom_citation.annotation}}
|
| [29] |
王少剑, 高爽, 王宇渠. 基于流空间视角的城市群空间结构研究: 以珠三角城市群为例[J]. 地理研究, 2019, 38(8): 1849-1861.
随着现代交通、通信以及信息技术的发展,基于网络社会的“流空间”成为研究城市群空间结构的重要理论前沿。借助珠三角城市群9个城市的人流、物流、资金流和信息流数据,对珠三角城市群空间结构的现状和发展趋势进行综合性判断。研究发现:① 珠三角城市群的空间结构现状在“点-线-网-面域”4个层面均呈现出明显单极化态势,广州市是“流空间”视角下珠三角城市群的核心,区域网络结构呈现出“缺位型金字塔形结构”;② 珠三角城市群网络的未来发展中位于不同层级的城市将起着不同的作用,其中广州、深圳、东莞等城市对空间结构发展起着导向性作用,而佛山、中山等城市将承担着联系中转站功能;③ 珠三角各城市的流度辐射区一体化明显,各城市辐射影响区的空间形态也表明了各城市的功能圈和势力范围。未来随着全球化趋势和区域一体化政策的加强,珠三角城市群的集聚效应将不断转化为扩散效应,将极大提升珠三角城市群对全球范围内资源的吸聚和配置能力,助力珠三角城市群走向网络化的发展时代。
[
With the development of modern transportation, communication and information technology, the "space of flow" based on network society has become an important theoretical frontier for studying urban spatial structure. Based on the passenger flow, material flow, fund flow and internet information flow in nine cities of the Pearl River Delta, this paper makes a comprehensive judgment on the present situation and development trend of spatial structure of urban agglomeration in this region. Research findings are as follows: (1) The present situation of urban spatial structure in the Pearl River Delta presents obvious unipolarization, and Guangzhou is the core of the delta based on the "space of flow". (2) Cities at different levels will play different roles in the future development of the urban agglomeration network. Guangzhou, Shenzhen and Dongguan play a leading role in the development of spatial structure, while Foshan, Zhongshan and other cities will assume the function of connecting transit stations. (3) The urban areas of the Pearl River Delta are well integrated. The spatial form of the radiated area of each city also indicates the functional circle and sphere of influence of each city. In the future, with the strengthening of globalization and regional integration policies, the agglomeration effect of the Pearl River Delta region will be transformed into diffusion effect, which will greatly improve the ability of the delta to absorb and allocate resources on a global scale. {{custom_citation.content}}
{{custom_citation.annotation}}
|
| [30] |
范文静, 唐承财. 地质遗产区旅游产业融合路径探析: 以黄河石林国家地质公园为例[J]. 资源科学, 2013, 35(12): 2376-2383.
[
{{custom_citation.content}}
{{custom_citation.annotation}}
|
| [31] |
刘伟. 上海海派文化与水上旅游产业融合发展研究[J]. 中国人口·资源与环境, 2014, 24(S2): 372-375.
[
{{custom_citation.content}}
{{custom_citation.annotation}}
|
| [32] |
朱媛媛, 汪紫薇, 顾江, 等. 基于“乡土-生态”系统韧性的红色旅游资源利用空间格局优化研究: 以大别山革命老区为例[J]. 自然资源学报, 2021, 36(7): 1700-1717.
[
{{custom_citation.content}}
{{custom_citation.annotation}}
|
| [33] |
李成宇, 张士强. 中国省际水-能源-粮食耦合协调度及影响因素研究[J]. 中国人口·资源与环境, 2020, 30(1): 120-128.
[
{{custom_citation.content}}
{{custom_citation.annotation}}
|
| [34] |
江孝君, 杨青山, 刘鉴. 中国地级以上城市“五化”协调发展时空格局及影响因素[J]. 地理科学进展, 2017, 36(7): 806-819.
加快推进绿色化与工业化、城镇化、农业现代化、信息化的协同发展是全面建成小康社会和实现经济社会可持续发展的必然要求。本文以中国342个地级及以上城市为研究对象,构建“五化”协调发展水平及其效率测度指标体系,采用耦合协调模型、数据包络分析模型、面板数据回归模型,测度分析了2008和2013年各行政单元“五化”协调水平、发展效率、空间分异特征及影响因素。结果表明:①“五化”发展综合度、耦合度及协调度均呈上升趋势且区域差异逐渐缩小,但环渤海、长三角及珠三角等东部地区发展水平仍明显高于中西部地区。②“五化”协调发展空间分异呈“集群化”、“等级化”及“梯度化”特征,呈现东部>中部>西部的发展格局。③“五化”协调发展综合效率和规模效率较低且区域差异显著,纯技术效率较高且区域差异较小;“五化”协调发展效率呈“等级化”及“阶梯化”特征,效率值的高低与城市行政级别等级格局基本一致,且从东部向中西部地区依次降低。④“五化”协调规模效率较低是导致综合效率低的关键原因;“五化”协调度空间格局的形成是自然地理环境、经济社会发展差异等综合因素共同作用的结果。
[
Accelerating the coordinated development of greenization, industrialization, urbanization, agricultural modernization, and informationization is a key requirement for building a comprehensive well-off society and realizing the sustainable development of the economy and society. Based on data of the 342 prefecture level and above administrative units in China, this study constructed an index system for evaluating the coordination level and efficiency of the "Five Modernizations" coordinated development, and used the coupled coordination model, data envelopment model, and panel data regression analysis model to analyze the coordination level, development efficiency, spatial distribution, and influencing factors of the "Five Modernizations" coordinated development of each administrative unit in 2008 and 2013.The results show that: (1) Between 2008 and 2013, the comprehensiveness degree, coupling degree, and coordination degree of the "Five Modernizations" coordinated development increased and the regional differences gradually reduced, but the level of development of the Circum-Bohai-Sea Region, the Yangtze River Delta, the Pearl River Delta, and other eastern China regions was still higher than that in central and western China. (2) The spatial distribution of the coordinated development of the "Five Modernizations" showed "clustering," "hierarchical," and "stepped" characteristics, with an eastern > central > western development pattern. (3) The comprehensive efficiency and scale efficiency of the coordinated development of the "Five Modernizations" was low and the regional difference was significant; the technical efficiency was high and the regional differences was small. The coordinated development efficiency of the "Five Modernizations" showed "hierarchical" and "stepped" characteristics, with efficiencies corresponding to cities' administrative level and decreasing from the eastern to the central and western regions. (4) The low scale efficiency was the key factor that led to low comprehensive efficiency of the "Five Modernizations" coordinated development. The spatial pattern of the "Five Modernizations" coordination degree was the result of the differences and interactions between complex geographical environment, economic, and social development factors. {{custom_citation.content}}
{{custom_citation.annotation}}
|
| [35] |
{{custom_citation.content}}
{{custom_citation.annotation}}
|
| [36] |
孙平军, 修春亮, 丁四保, 等. 东北地区域发展的非均衡性与空间极化研究[J]. 地理科学进展, 2011, 30(6): 715-723.
基于对空间极化概念界定的基础上,首先从要素流的视角构建区域发展衡量指标——城镇集聚能力,并从整体上评价1995-2008 年东北三省区域发展演变格局;其次利用差异指数和极化指数,从不同集聚层次对东北三省区域发展非均衡性和极化程度进行测度。研究发现:①从区域发展衡量指标的动态演变格局来看:1995-2008年间东北三省区域发展是一个波浪起伏的过程,整体水平稍有下降;集聚能力得分排序及其演变趋势表明,中心城市、交通枢纽城市和资源城市主宰着东北三省区域发展格局的演变;四中心城市呈现出由北往南递增的发展趋势,且由四城市形成的经济区实体功能开始显化,并沿哈大铁路形成一条不连续的“极化轴”,区域发展中心逐步南移;区域发展的地域差异性非常明显。②从区域发展的非均衡性和极化指数来看:整体上呈增长趋势,其中市区极化程度明显高于县(县级市),且发展演进方向互异;空间分布上非均衡性指数表现出辽宁省>黑龙江省>吉林省,而崔-王指数为黑龙江省>辽宁省>吉林省;城市类型(资源城市与非资源城市)表现出异向发展趋势,其中资源城市呈绝对的下降趋势,且资源城市的极化程度明显低于非资源城市。
[
Based on the concept of spatial polarization, this paper built up a regional development index from the perspective of element flows, which is called urban agglomeration ability, and analyzed the regional development evolution in the three provinces of Northeast China from 1995 to 2008 on the whole. Secondly, the paper used the difference indexes and polarization indexes to measure the degrees of inequality and polarization of the regional development in Northeast China for different concentration levels. The results show that: (1) from the viewpoint of the dynamic evolution of the patterns of regional development, from 1995 to 2008, the regional development of Northeast China had an undulating course, and the overall level was slightly decreased. The agglomeration ability and its evolution trend showed that the center cities, the traffic hub cities and the resource cities played an important role in the regional development pattern evolution. It was showed that the four cities showed that the development trend was increased from north to south. The formed city economic zones began to present their functions, and the Harbin-Dalian Railway became a discrete"polarization axis". The regional development center was gradually moved to the south with the differences of the regional development. (2) The whole region showed a growing trend, in which the municipal administrative areas had a higher degree of polarization than the county level subdivisions, with different directions of evolution. The spatial distribution of inequality index had a sequence of Liaoning Province > Heilongjiang Province > Jilin Province, and the TW index showed a sequence of Heilongjiang > Liaoning > Jilin. The resources cities had an absolute decline, and had a lower polarization degree than the non-resources cities.
{{custom_citation.content}}
{{custom_citation.annotation}}
|
| [37] |
叶磊, 欧向军. 长三角地区经济极化过程与空间演变分析[J]. 地理科学进展, 2012, 31(12): 1668-1677.
[
{{custom_citation.content}}
{{custom_citation.annotation}}
|
| [38] |
{{custom_citation.content}}
{{custom_citation.annotation}}
|
| [39] |
{{custom_citation.content}}
{{custom_citation.annotation}}
|
| {{custom_ref.label}} |
{{custom_citation.content}}
{{custom_citation.annotation}}
|


 PDF(4103 KB)
 图1 城市群“文—旅”产业融合发展的分析框架
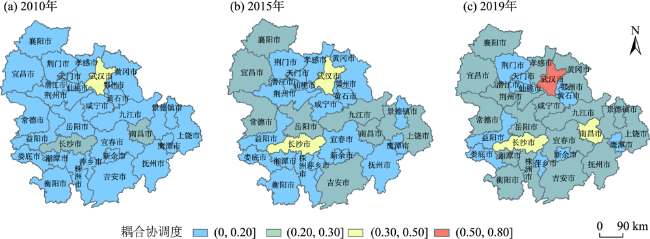
 表1 城市群“文—旅”产业融合发展评价指标体系表2 “文—旅”产业融合发展耦合度与耦合协调度划分标准表3 2010—2019年长江中游城市群“文—旅”产业融合发展耦合度和耦合协调度统计特征及其分布区间占比图2 2010—2019年长江中游城市群“文—旅”产业融合发展极化趋势图3 2010—2019年长江中游城市群“文—旅”产业融合发展耦合协调度等级分异图4 长江中游城市群“文—旅”产业融合发展的驱动机制
/
| 〈 |
|
〉 |


 AI Summary

