
Source rupture process of the 2016 Kumamoto prefecture, Japan, earthquake derived from near-source strong-motion records
-
摘要:
2016年4月15日16时25分(UTC),日本熊本县发生MW7.1强烈地震,给当地人员、建筑及经济造成严重灾难和巨大损失.日本地震观测网F-net给出的震源机制解显示此次地震的震源位置为130.7630°E,32.7545°N,深度12.45 km,节面Ⅰ:走向N131°E、倾角53°、滑动角-7°;节面Ⅱ:走向N226°E、倾角84°、滑动角-142°.与此同时,余震的震中分布及其震源机制结果显示主震的震源机制在破裂过程中有可能发生了变化,单一的震源机制不足以充分解释观测数据.本文依据GNSS和InSAR地表形变反演结果为约束,并结合活动构造资料为参考,构建了震源机制变化的有限断层模型,采用水平层状介质模型,利用日本强震观测台网K-NET和KiK-net的近场加速度观测记录,通过多时间窗线性波形反演方法反演了此次地震的震源破裂过程.研究结果显示,这是一次沿Futagawa-Hinagu断层带发生的右旋走滑破裂事件,发震断层分为南北两段,其中北段走向N235°E、倾角60°,南段走向N205°E、倾角72°,断层深度范围和余震深度分布基本一致,断层面上滑动主要集中于断层北段,最大滑动量约7.9 m,整个断层的破裂过程持续约18 s,释放地震矩5.47×10¹⁹ N·m(MW7.1).
Abstract:On 15 April, 2016 (UTC) a great earthquake of magnitude MW7.1 occurred in Kumamoto prefecture, Japan. The strong shocking of the earthquake caused grave disasters and severe damages. The focal mechanism solution released by F-net of NIED of Japan indicates that the hypocenter is at 130.7630°E, 32.7545°N, and a depth of 12.45 km. For nodal plane Ⅰ, the strike is N131°E, the dip is 53°, and the rake angle is-7°; for nodal plane Ⅱ the strike is N226°E, the dip is 84°, and the rake angle is-142°. The epicenter distribution and focal mechanisms of its aftershocks imply that the mechanism of the mainshock may have changed during the source rupture process, thus a single focal mechanism is not enough to explain the source process adequately. In this study, based on the inversion result of GNSS and InSAR surface deformation, with active structures for reference, we construct a finite fault model with focal mechanism changes, and derive the source rupture process by multi-time-window linear waveform inversion method using the strong-motion data (0.05~1.0 Hz) obtained by K-NET and KiK-net of Japan. Our result shows that the Kumamoto earthquake is a right-lateral strike slipping rupture event along the Futagawa-Hinagu fault zone, and the seismogenic fault is divided into a northern segment and a southern one. The strike and the dip of the northern segment are N235°E, 60° respectively. And for the southern one, they are N205°E, 72° respectively. The depth range of the fault model is consistent with the depth distribution of the aftershocks, and the slip on the fault plane is mainly concentrated on the northern segment, in which the maximum slip is about 7.9 meters. The rupture process of the whole fault continues for approximately 18 seconds, and the total seismic moment released is 5.47×10¹⁹ N·m (MW7.1).
-

-
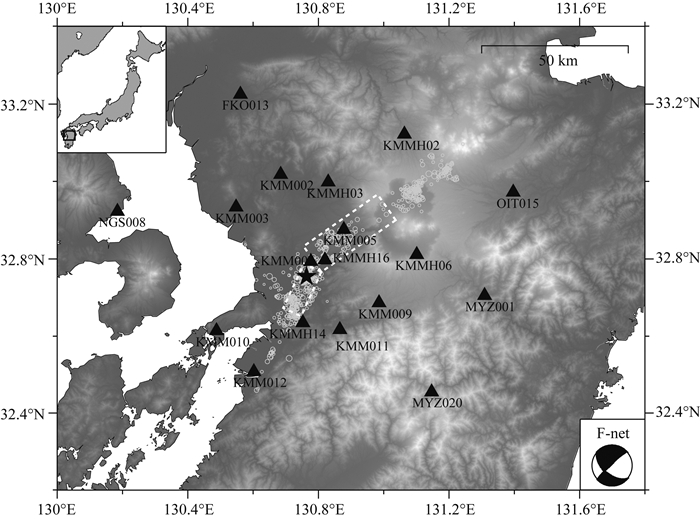
图 1
主震震中 (五角星) 位置、强震台站及余震分布
Figure 1.
Location of the strong-motion stations (triangle) used in this study and the mainshock (star) with its aftershocks (circle) happened in 24-hour
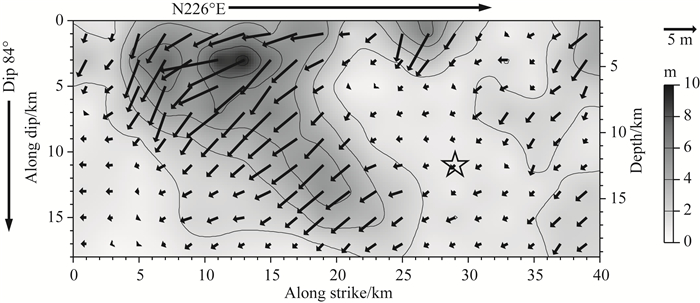
图 2
初步反演使用单段式断层模型得到的滑动分布
Figure 2.
Slip distribution derived from the preliminary inversion using the single-segment fault model
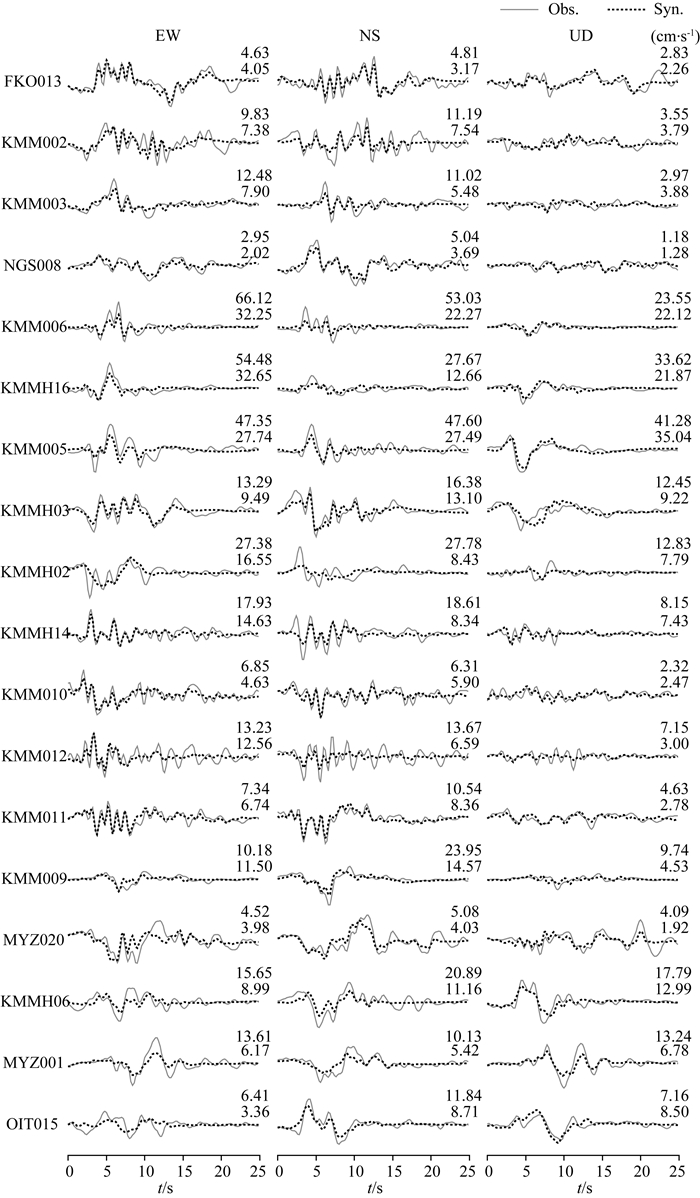
图 3
初步反演使用单段式断层模型得到的合成波形与实际观测波形的比较 (速度时程)
Figure 3.
Comparison between the synthetic waveforms obtained from the preliminary inversion with the single-segment fault model and the observed ones (velocity)
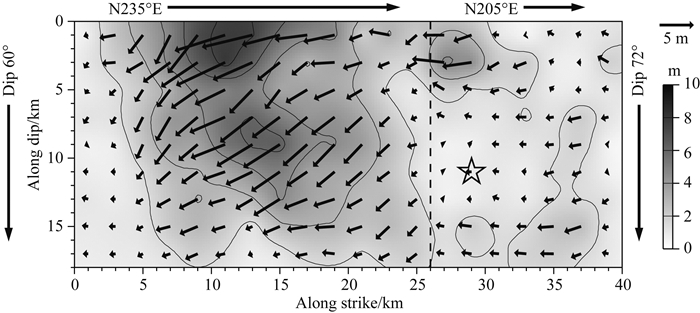
图 4
使用二段式断层模型反演得到的滑动分布
Figure 4.
Slip distribution derived from the inversion using the two-segment fault model
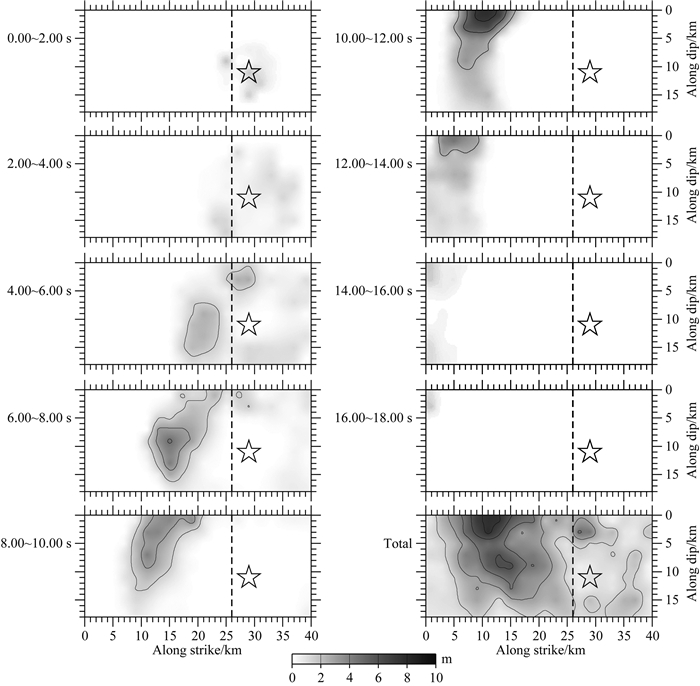
图 5
使用二段式断层模型反演得到的破裂过程
Figure 5.
The rupture process derived from the inversion using the two-segment fault model
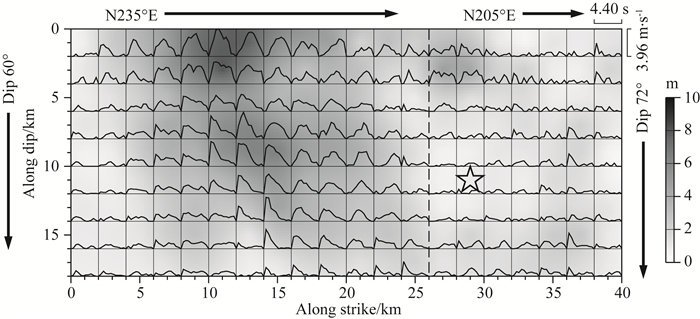
图 6
使用二段式断层模型反演得到的每个子断层的滑动速度时间函数,背景为断层面上的滑动量分布
Figure 6.
Slip-rate of each subfault derived from the inversion using the two-segment fault model. The background is the final slip distribution on the fault plane
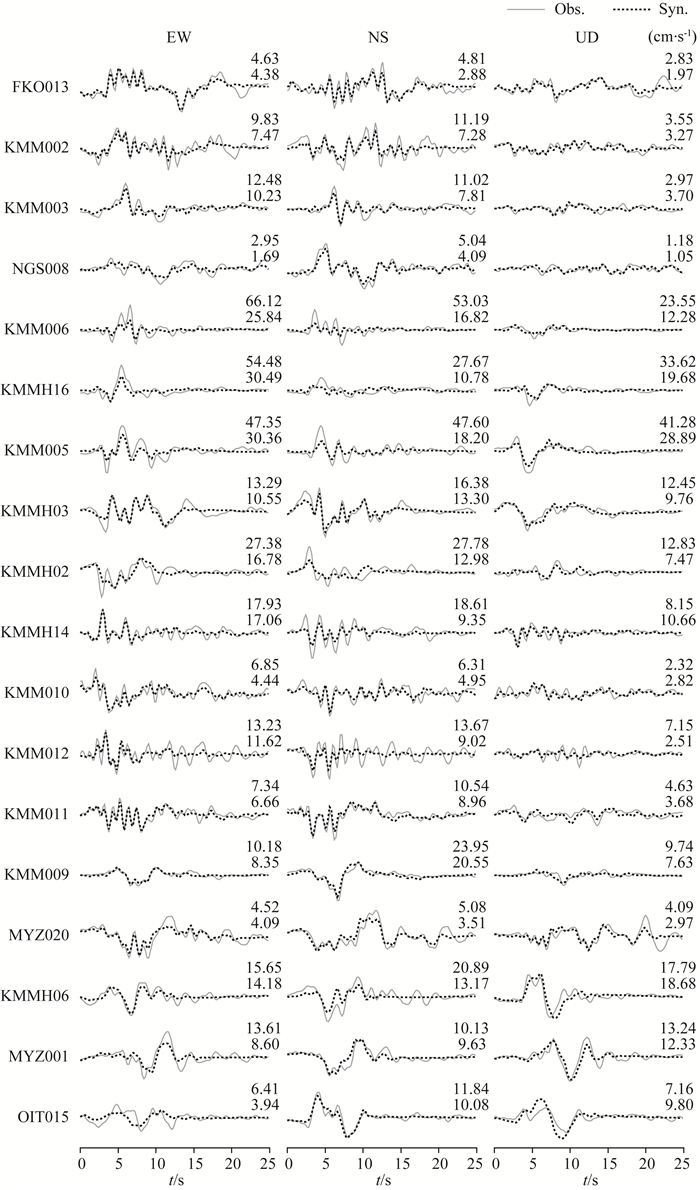
图 7
使用二段式断层模型反演得到的合成波形与实际观测波形的比较 (速度时程),在每个波形的右上方依次标出了实际观测波形和反演合成波形的最大值 (cm·s-1)
Figure 7.
Comparison between the synthetic waveforms obtained from the inversion with the two-segment fault model and the observed ones (velocity). The maximum values of the observed and synthetic waveforms are shown at the upper right of each waveform respectively
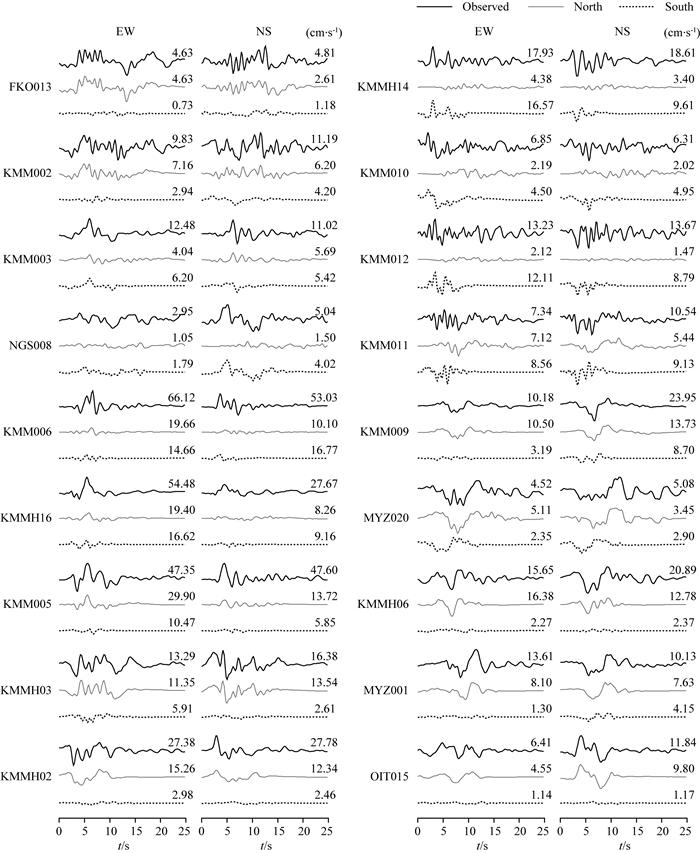
图 8
使用二段式断层模型反演分别得到的北段断层 (中) 和南段断层 (下) 上滑动合成波形水平分量的比较.实际观测波形也被列出 (上),同时在每个波形的右上方依次标出了实际观测波形和反演合成波形的最大值 (cm·s-1)
Figure 8.
Comparison between the horizontal component of synthetic waveforms obtained from the slips on the northern (middle) and southern (bottom) segment for the inversion using the two-segment fault model. The observed waveform is also shown (top), and the maximum values of waveforms are shown at the upper right of each waveform respectively

图 9
(a) 输入模型;(b) 使用无噪声合成数据反演得到的滑动分布;(c) 使用添加标准差为最大振幅10%高斯噪声的合成数据反演得到的滑动分布
Figure 9.
(a) Input model; (b) The slip distribution derived from the synthetic data without noise; (c) The slip distribution derived from the synthetic data with a Gaussian noise having a standard deviation of 10% of the maximum amplitude
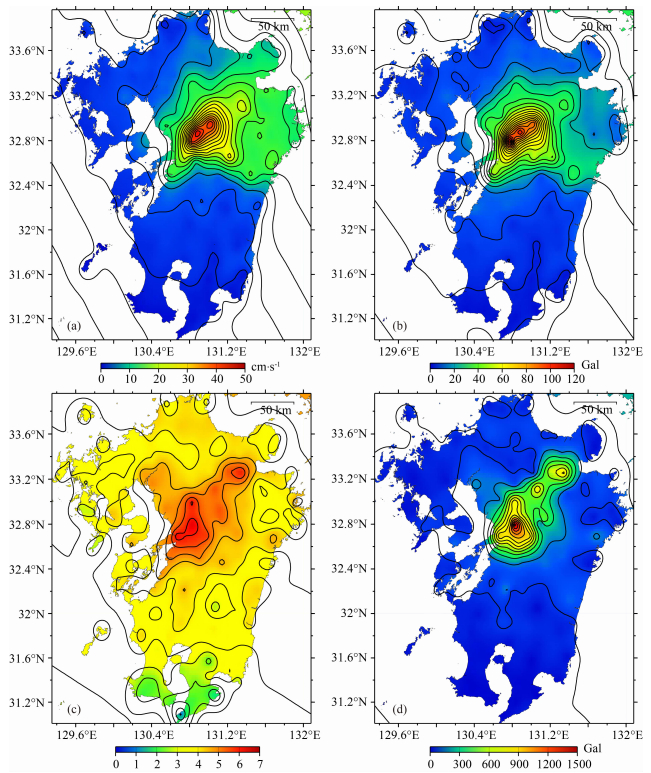
图 10
(a) 使用反演结果合成的PGV分布 (0.05~1.0 Hz);(b) 使用反演结果合成的PGA分布 (0.05~1.0 Hz);(c) NIED的实测烈度 (日本称震度) 分布;(d) NIED的实测PGA分布
Figure 10.
(a) The distribution of PGV synthesized by the inversion result (0.05~1.0 Hz); (b) The distribution of PGA synthesized by the inversion result (0.05~1.0 Hz); (c) The distribution of Japanese seismic intensity observed by NIED; (d) The distribution of PGA observed by NIED
表 1
本文中所使用的强震台站
Table 1.
Strong-motion stations used in this study
台站 纬度 (°N) 经度 (°E) 深度 (m) 台网 地点 FKO013 33.2252 130.5607 0 K-NET Yame KMM002 33.0185 130.6846 0 K-NET Yamaga KMM003 32.9336 130.5477 0 K-NET Tamana KMM005 32.8761 130.8774 0 K-NET Ohdu KMM006 32.7934 130.7772 0 K-NET Kumamoto KMM009 32.6858 130.9856 0 K-NET Yabe KMM010 32.6136 130.4874 0 K-NET Misumi KMM011 32.6167 130.8652 0 K-NET Tomochi KMM012 32.5078 130.6024 0 K-NET Yatsushiro MYZ001 32.7050 131.3089 0 K-NET Takachiho MYZ020 32.4550 131.1470 0 K-NET Shiiba NGS008 32.9231 130.1843 0 K-NET Kanagai OIT015 32.9722 131.3970 0 K-NET Takeda KMMH02 33.1220 131.0629 123.55 KiK-net Oguni KMMH03 32.9984 130.8301 200 KiK-net Kikuchi KMMH06 32.8114 131.1010 111 KiK-net Hakusui KMMH14 32.6345 130.7521 110 KiK-net Toyono KMMH16 32.7967 130.8199 252 KiK-net Mashiki  下载: 导出CSV
表 2
二段式断层模型参数
Table 2.
Parameters of the two-segment fault model
长度 (km) 宽度 (km) 走向 倾角 滑动角 断层北段 26 18 N235°E 60° -151° 断层南段 10 18 N205°E 72° 176°
下载: 导出CSV
-
Akaike H. 1980. Likelihood and the Bayes procedure.// Bernardo J M, DeGroot M H, Lindlely D V, et al. Bayesian Statistics. Valencia, Spain: University Press, 143-166.
Aki K, Richards P G. 2002. Quantitative Seismology. 2nd ed. Sausalito, Calif.: Univ. Sci. Books.
Aoi S, Kunugi T, Fujiwara H. 2004. Strong-motion seismograph network operated by NIED: K-NET and KiK-net. Journal of Japan Association for Earthquake Engineering, 4(3): 65-74. doi: 10.5610/jaee.4.3_65
Bouchon M. 1981. A simple method to calculate Green's functions for elastic layered media. Bulletin of the Seismological Society of America, 71(4): 959-971. https://www.researchgate.net/publication/215754837_A_simple_method_to_calculate_Green%27s_fuctions_for_elastic_layered_Media
Fukuyama E, Ishida M, Hori S, et al. 1996. Broadband seismic observation conducted under the FREESIA Project. Report of the National Research Institute for Earth Science and Disaster Prevention, 57: 23-31.
Fukuyama E, Ishida M, Dreger D S, et al. 1998. Automated seismic moment tensor determination by using on-line broadband seismic waveforms. Jishin, 51(1): 149-156(in Japanese with English abstract). https://www.jstage.jst.go.jp/article/zisin1948/51/1/51_1_149/_article
Hartzell S H, Heaton T H. 1983. Inversion of strong ground motion and teleseismic waveform data for the fault rupture history of the 1979 Imperial Valley, California, earthquake. Bulletin of the Seismological Society of America, 73(6A): 1553-1583. http://citeseerx.ist.psu.edu/viewdoc/summary?doi=10.1.1.456.655
Kennett B L N, Kerry N J. 1979. Seismic waves in a stratified half space. Geophysical Journal International, 57(3): 557-583. doi: 10.1111/gji.1979.57.issue-3
Kinoshita S. 1998. Kyoshin net (K-net). Seismological Research Letters, 69(4): 309-332. doi: 10.1785/gssrl.69.4.309
Kubo H, Suzuki W, Aoi S, et al. 2016. Source rupture processes of the 2016 Kumamoto, Japan, earthquakes estimated from strong-motion waveforms. Earth, Planets and Space, 68(1): 161. doi: 10.1186/s40623-016-0536-8
Lawson C L, Hanson R J. 1974. Solving Least Squares Problems (Vol. 161). Englewood Cliffs, NJ: Prentice-hall.
Nakamura M, Yoshida Y, Zhao D P, et al. 2008. Three-dimensional P-and S-wave velocity structures beneath Japan. Physics of the Earth and Planetary Interiors, 168(1-2): 49-70. doi: 10.1016/j.pepi.2008.04.017
Olson A H, Apsel R J. 1982. Finite faults and inverse theory with applications to the 1979 Imperial Valley earthquake. Bulletin of the Seismological Society of America, 72(6A): 1969-2001. http://www.bssaonline.org/content/72/6A/1969.short
Sekiguchi H, Irikura K, Iwata T. 2000. Fault geometry at the rupture termination of the 1995 Hyogo-ken Nanbu earthquake. Bulletin of the Seismological Society of America, 90(1): 117-133. doi: 10.1785/0119990027
Sekiguchi H, Irikura K, Iwata T. 2002. Source inversion for estimating the continuous slip distribution on a fault-introduction of Green′s functions convolved with a correction function to give moving dislocation effects in subfaults. Geophysical Journal International, 150(2): 377-391. doi: 10.1046/j.1365-246X.2002.01669.x
Wessel P, Smith W H F. 1995. New version of the Generic Mapping Tools released. Eos, Transactions American Geophysical Union, 76(33): 329. http://www.scirp.org/reference/ReferencesPapers.aspx?ReferenceID=121998
Wu C J, Takeo M. 2004. An intermediate deep earthquake rupturing on a dip-bending fault: Waveform analysis of the 2003 Miyagi-ken Oki earthquake. Geophysical Research Letters, 31(24): L24619. doi: 10.1029/2004GL021228
Yabuki T, Matsu′ura M. 1992. Geodetic data inversion using a Bayesian information criterion for spatial distribution of fault slip. Geophysical Journal International, 109(2): 363-375. doi: 10.1111/gji.1992.109.issue-2
-
图(10)
表(2)
计量
- 文章访问数:
- PDF下载数:
- 施引文献: 0